It’s a common occurrence: a digital signboard over the freeway tells you to expect a 15-minute trip, but traffic clears and you arrive in 10 minutes. Or, worse, you hit a clog and arrive in 30 minutes.

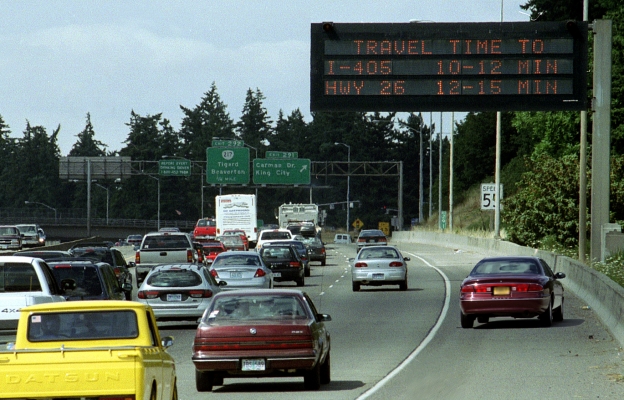
Sometimes those signboards, called dynamic message signs, are way off, Portland State University researcher Kristin Tufte found. But sometimes that doesn’t matter.

Tufte examined the signboards, called dynamic message signs, along Portland-area freeways in an OTREC project. Drivers typically reach their destinations earlier or later than the signs told them to expect when a so-called “shock wave” forms or dissipates; that is, when traffic suddenly bunches or clears up.

Currently, only three of the 30 or so message signs in the Portland metro area display travel times. Detectors at freeway onramps feed those signs. As a result, large swaths of freeway without onramps also have no data. To be most useful, new message signs would require more detectors in certain areas.

Take the busy Marquam Bridge in Portland, where busy freeways merge and there is no signboard. “There’s no detection for the whole length of the bridge,” Tufte said. “If you really want to have accurate travel times, you have to have detection there.”

As expected, Tufte found that traffic bunching or clearing in blind zones can throw off the accuracy of travel times displayed. Surprisingly, that inaccurate information is...

Read more

Even residents of a gingerbread candyland can't get around with holiday magic alone. After all, Santa's elves still need a reliable way to get from their cozy homes to the workshop.

Sadly, transportation planners have turned a frosty shoulder to sugar-based transit systems. Until now.

On Dec. 3, Portland State University's Students in Transportation Engineering and Planning held the first gingerbread transit station competition. Four teams of students pulled their attention away from human transit to focus on the needs of gingerbread people and misfit toys.

Dealing with building materials of unknown structural properties, students field engineered solutions. Licorice sticks stood in for steel rails, candy canes for bicycle racks. For a binding agent, students mixed cream of tartar and egg whites instead of portland cement.

The resulting transit system has already resulted in fewer traffic gum-ups and a drastic reduction in ultrafine powdered-sugar emissions. Sleigh-travel-time reliability has also improved.

Researchers are now assessing the durability of corn-syrup-reinforced composites in candy bridges, the potential for alkali-silica reaction in gingerbread pavement and the possibility that someone hungry will stumble in and eat the infrastructure.

The winning design team was Transit Wonderland, composed of Jesse Boudart, Sara Morrissey, Mark Haines and Meeyonwoo Lim.

Good transportation decisions rely on good models. Yet, despite advances in transportation modeling, there had been no dedicated training ground for the next generation of modelers. That all changed with the launch of the Oregon Modeling Collaborative Nov. 12. The collaborative will serve as a living laboratory to put the research from some of America’s top modelers into practice across Oregon.

On Nov. 12, we welcomed Peter Appel, administrator of the federal Research and Innovative Technology Administration, to Portland to kick off the collaborative with researchers, practitioners and policymakers from across the Northwest. Appel, confirmed by the U.S. Senate as administrator in 2009, has worked on U.S. Department of Transportation initiatives aimed at getting researchers and professionals to address safety, efficiency and environmental sustainability across all forms of transportation.

Groundbreaking research at the Oregon Transportation Research and Education Consortium has already produced models to account for bicycle trips and greenhouse gas emissions and to predict earthquake risk to highway bridges. However, models don’t do any good if agencies can’t afford the staff time and resources to use them. The Oregon Modeling Collaborative helps fill this gap by educating the next...

Read more

The video begins at 1:34.

View slides

Abstract: The combination of increasing challenges in administering household travel surveys as well as advances in global positioning systems (GPS) and geographic information systems (GIS) technologies motivated this project. It tests the feasibility of using a passive travel data collection methodology in a complex urban environment, by developing GIS algorithms to automatically detect travel modes and trip purposes. The study was conducted in New York City where the multi-dimensional challenges include urban canyon effects, an extremely dense and diverse set of land use patterns, and a complex transit network. Our study uses a multi-modal transportation network, a set of rules to achieve both complexity and flexibility for travel mode detection, and develops procedures and models for trip end clustering and trip purpose prediction. The study results are promising, reporting success rates ranging from 60% to 95%, suggesting that in the future, conventional self-reported travel surveys may be supplemented, or even replaced, by passive data collection methods.

Speaker Bio: Cynthia Chen is an associate professor in the department of civil and environmental engineering at the University of Washington. She obtained her Ph.D in civil and...

Read more

No archived materials are available for this presentation.

New Travel Demand Models

PRESENTATION ARCHIVE

OVERVIEW

Conventional four-step travel demand models are used by nearly all metropolitan planning organizations (MPOs), state departments of transportation, and local planning agencies, as the basis for long-range transportation planning in the United States. A flaw of the four-step model is its relative insensitivity to the so-called D variables. The D variables are characteristics of the built environment that are known to affect travel behavior. The Ds are development density, land use diversity, street network design, destination accessibility, and distance to transit. In this seminar, we will explain how we developed a vehicle ownership model (car shedding model), an intrazonal travel model (internal capture model), and mode choice model that consider all of the D variables based on household travel surveys and built environmental data for 32, 31, and 29 regions, respectively, validates the models, and demonstrates that the models have far better predictive accuracy than Wasatch Front Regional Council (WFRC)/Mountailand Association of Governments’ (MAG) current models.

In this webinar, researchers Reid Ewing and Sadegh Sabouri will...

Read more

The video begins at 0:52.

Abstract:  This seminar concludes the eight week exploration of transportation models and decision tools with a look to the future. Oregon is known for its history of forward thinking policies around sustainable transportation, including linking land use and transportation planning at the regional level, investments in transit and non-motorized modes, and statewide legislation to reduce greenhouse gas emissions. To aid these transportation planning and policy decisions, Oregon has developed some of the most sophisticated models and analytic tools currently in use in the United States. As Oregon moves forward to address the next set of challenges - energy security, climate change, economic constraints and equity, models will need to provide new information at different spatial and temporal scales to support long range planning - 30 to 50 years out - as well as near term decisions - 1 to 5 years ahead. Beth Wemple, a Portland-based consultant with Cambridge Systematics, will share her view on Oregon's transportation future. Keith Lawton, consultant and former transportation planner at Metro, will respond by discussing the next steps for model development and application needed to support this agenda.

Speaker Bio: Keith Lawton is a transport modeling consultant and past Director of Technical services, Metro Planning Department, Portland, OR. He has been active in model...

Read more

Pages