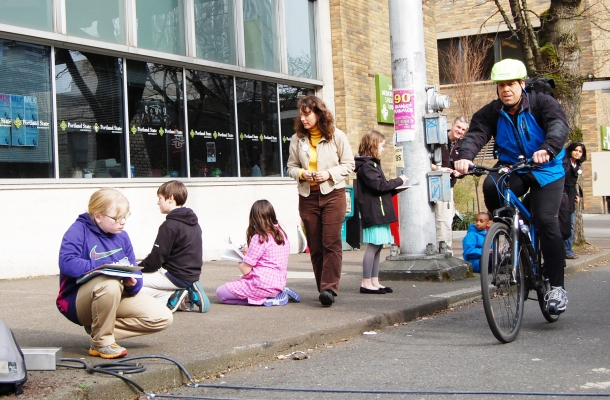
OTREC turned its education efforts on a decidedly younger crowd March 13: sixth graders. A class from Rochester, N.Y., visited Portland on a trip geared toward improving bicycling in their own community.

The students, from Genesee Community Charter School, visited the OTREC offices to learn about active transportation research methods. They took part in group exercises designed to get them thinking about the planning and engineering challenges of transportation systems set up to serve multiple transportation modes.

The highlight of the day came when the students took to Portland’s streets — OTREC’s living laboratory — to conduct research of their own. Armed with bicycle-counter tubes and infrared detectors, students counted cyclists and pedestrians passing on the Broadway cycle track on Portland State University’s campus.

Other students verified the technology with manual counters.

Students moved on to their next stop on a four-day tour of Portland with a better sense of what kind of data researchers collect and how they can use those data to inform policy. Given their experience — the students already have influenced their city on policy ranging from Erie Canal re-watering to an urban art corridor to skate parks — they stand a good chance of using Portland’s lessons to build a bike-friendly Rochester.

This fall, the Friday transportation seminar series at Portland State University has focused on data collection and how information is used to make transportation investments. The Oct. 26 seminar, with the University of Minnesota’s Greg Lindsey, covered tracking and modeling travel behavior.

Engineers and planners alike have relied on traffic counts for their traffic models, but data behind bike and pedestrian travel has been fuzzy. Now, researchers such as Lindsey are offering new methods for conducting bike and pedestrian counts on trails and multiuse paths.

With little guidance from the Federal Highway Administration, Lindsey said, most of the efforts in creating best practices have bubbled up from communities like the Twin Cities, chosen as Nonmotorized Transportation Pilot Cities. Lindsey and his researchers monitored six trails in Minneapolis, using inductive loops and infrared beams.

To address calibration problems and offer validity to their field numbers, Lindsey also sent students into the field to verify counts. The technology allowed for finer-grained detail, especially over a 24-hour period. OTREC Director Jennifer Dill noted, “Too much in the past we’ve lumped “bike and peds” together and your work and analysis is demonstrating that they truly are different modes, with different behaviors.”

Lindsey stressed the importance of conducting this type of research, and measuring our “bicycle miles traveled” and “pedestrian miles traveled” in...

Read more

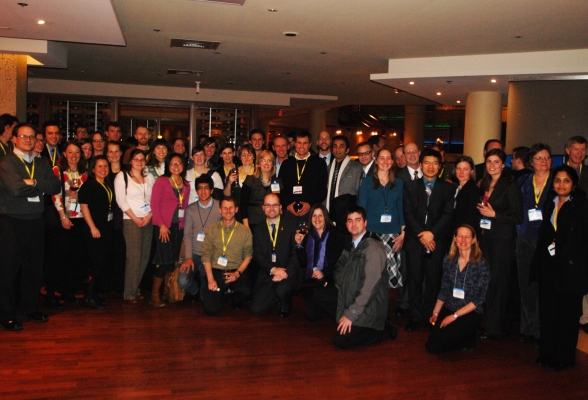
If you weren’t one of the 10,000 people who attended the Transportation Research Board’s Annual Meeting in January, there are fifty students and twenty faculty for PSU, UO, OSU and OIT who can tell you what they learned there.  OTREC's bright yellow lanyards made our presence especially visible! PSU student Brian Davis blogged about his experience, OTREC’s Jon Makler was interviewed in a local newspaper, and the Oregon “delegation” at the conference was covered by both local and national blogs. Team OTREC filed some daily debriefs, highlighting presentations on topics such as federal stimulus investments in Los Angeles and Vermont’s efforts to address their transportation workforce crisis with returning military veterans (as well as the...

Read more

Watch condensed preview video
Watch full video
View slides

If you would like to receive continuing education credits such as PDH or CM, please make sure to complete this evaluation form once you've watched the entire video so that we have a record of your attendance.

Why model pedestrians?

A new predictive tool for estimating pedestrian demand has potential applications for improving walkability. By forecasting the number, location and characteristics of walking trips, this tool allows for policy-sensitive mode shifts away from automobile travel.

There is growing support to improve the quality of the walking environment and make investments to promote pedestrian travel. Despite this interest and need, current forecasting tools, particularly regional travel demand models, often fall short. To address this gap, Oregon Metro and NITC researcher Kelly Clifton worked together to develop...

Read more
Data Science Course, Part 1: Introduction to Scientific Computing for Planners, Engineers, and Scientists with Tammy Lee and Joe Broach

For the third year, we're hosting our two-part data science course in Portland, OR. You can register for one part or the other– or attend both at a discount: Data Science Course - Part 2: Intermediate Scientific Computing for Planners, Engineers, and Scientists

Did you ever feel you are “drinking from a hose” with the amount of data you are attempting to analyze? Have you been frustrated with the tedious steps in your data processing and analysis process and thinking, “There’s gotta be a better way to do things”? Are you curious what the buzz of data science is about? If any of your answers are yes, then this course is for you.

Classes will all be hands-on sessions with lecture, discussions and labs. Participants can choose to sign up for one or both courses. For more information, download the syllabus (PDF)This course was developed as part of a NITC education project: Introduction to Scientific Computing for Planners, Engineers, and Scientists.

Agenda: Part One -...

Read more

Watch video

View slides

Summary: Although the running of red lights is perceived by motorists as a commonplace behavior for cyclists, little research has been done on the actual rates of cyclist compliance at signalized intersections. Furthermore, little is known about the factors that influence cyclist non-compliance. This research seeks to illuminate the rates of and reasons for infringement against red lights using video footage and survey data from cyclists in Oregon. 

Bio: Sam became interested in transportation and planning while studying abroad in Freiburg im Breisgau, Germany. After benefiting from the efficient transit service and excellent walkability there, he came back to the states with a gusto for safe, efficient, and environmentally sustainable transportation. After finally figuring out what to do with his Civil Engineering degree, he enrolled in Portland State. Sam's research interests include cyclist behavior and the comprehension and safety implications of new infrastructure. Originally hailing from Kansas, he has grown weary of Wizard of Oz jokes but is otherwise happy to call Portland his home, especially with the abundance of good coffee, micro brews, and stellar pie that PDX has to offer.

The proliferation of information technology in the transportation field has opened up opportunities for communication and analysis of the performance of transportation facilities. The Highway Capacity Manual relies on rules of thumb and small data samples to generate levels of service to assess performance, but modern detection technology gives us the opportunity to better capture the dynamism of these systems and examine their performance from many perspectives. Travelers, operations staff, and researchers can benefit from measurements that provide information such as travel time, effectiveness of signal coordination, and traffic density. In particular, inductive loop detectors show promise as a tool to collect the data necessary to generate such information. But while their use for this purpose on restricted‐access facilities is well understood, a great many challenges remain in using loop detectors to measure the performance of surface streets.

This thesis proposes 6 methods for estimating arterial travel time. Estimates are compared to simulated data visually, with input/output diagrams; and statistically, with travel times. Methods for estimating travel time are applied to aggregated data and to varying detector densities and evaluated as above. Conclusions are drawn about which method provides the best estimates, what levels of data aggregation can still provide useful information, and what the effects of detector density are on the quality of estimates....

Read more
Data Science Course - Part 2: Intermediate Scientific Computing for Planners, Engineers, and Scientists with Tammy Lee and Joe Broach

For the third year, we're hosting our two-part data science course in Portland, OR. You can register for one part or the other– or attend both at a discount: Data Science Course, Part 1: Introduction to Scientific Computing for Planners, Engineers, and Scientists

Did you ever feel you are “drinking from a hose” with the amount of data you are attempting to analyze? Have you been frustrated with the tedious steps in your data processing and analysis process and thinking, “There’s gotta be a better way to do things”? Are you curious what the buzz of data science is about? If any of your answers are yes, then this course is for you.

Classes will all be hands-on sessions with lecture, discussions and labs. Participants can choose to sign up for one or both courses. For more information, download the syllabus (PDF). This course was developed as part of a NITC education project: Introduction to Scientific Computing for Planners, Engineers, and Scientists.

Agenda: Part Two - Intermediate Course

  1. Transforming, visualizing, and modeling data
  2. ...
Read more

Pages